
Explore Big Bear Communities
Featured Blog Posts
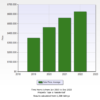
A Look into Big Bear’s Market Trends, 2019-Today
With the slowing of COVID, we have had numerous requests for a market update comparing the real estate frenzy of the past few years with today’s more normalized market. Simply put, the markets of 2020 and 2021 were unprecedented. Given that, those are not market periods we … [Read More]
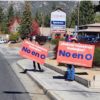
No on Measure O Campaign Proves to be a Success
Like most tourist destinations, our mountain community saw a record number of visitors in 2020 and 2021. We also experienced a significant increase in buyer interest which resulted in record sales numbers. In 2020, 1,814 single family residences sold and, in 2021, 1,753 were … [Read More]

Looking to Ditch That Big Bear Cabin Look? Here’s Some Tips to Modernizing Your Mountain Home….
"We want something cabin-y." This is something I hear ALL the time. Most of my clients want to escape from the city to their mountain home that really feels mountainous. But here's the thing, you can still get that feeling without the bears and lacquered wood. Don't get me … [Read More]
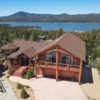
Looking For A Vacation Rental Property in Big Bear? Here’s Some Tips to What Makes One Successful…
Vacation rentals are likely my most discussed topic while showing property to potential buyers. "How much could this generate annually?" "What are the restrictions?" "Do I need a hot tub?" "What is the best vacation rental area?" . Here in Big Bear, 80% of the homes sold are … [Read More]
Big Bear’s Newest Listings
-
$430,000
145 San Bernardino Avenue
Sugarloaf, CA -
$599,000
103 Big Bear Trail
Fawnskin, CA -
$599,000
103 Big Bear Tract
Fawnskin, CA -
$1,025,000
38634 N Shore Drive
Fawnskin, CA -
$2,245,000
41611 St Hwy 38
Big Bear Lake, CA -
$637,777
912 Bear Mountain Road
Big Bear City, CA -
$729,900
41647 Brownie Lane
Big Bear, CA -
$729,900
41647 Brownie Lane
Big Bear Lake, CA -
$637,777
912 S Bear Mountain Road
Big Bear City, CA -
$2,245,000
41611 State Hwy 38
Fawnskin, CA -
$375,000
629 Sugarloaf Boulevard
Big Bear City, CA -
$789,000
423 Pine View Drive
Big Bear City, CA -
$1,050,000
42592 Ruben Way
Big Bear, CA -
$1,050,000
42592 Ruben Way
Big Bear Lake, CA -
$215,000
533 Pine Ln
Sugarloaf, CA -
$449,900
711 Cienega Road #C
Big Bear Lake, CA -
$375,000
629 Sugarloaf Boulevard
Big Bear City, CA -
$599,900
43065 Goldmine Woods Lane
Big Bear Lake, CA -
$719,900
505 Barrett Way
Big Bear City, CA -
$625,000
284 Santa Clara Boulevard
Big Bear Lake, CA -
$625,000
284 Santa Clara Boulevard
Big Bear Lake, CA -
$699,900
129 Poplar Street
Big Bear Lake, CA -
$449,900
711 Cienega Road #C
Big Bear Lake, CA -
$699,900
129 Poplar Street
Big Bear Lake, CA -
$1,149,000
615 Thrush Drive
Big Bear Lake, CA -
$1,149,000
615 Thrush Drive
Big Bear Lake, CA -
$779,900
150 Lodgepole Pl
Big Bear Lake, CA -
$799,000
42646 Constellation Drive
Big Bear, CA -
$365,000
1030 S Minton Avenue
Big Bear City, CA -
$799,000
39470 Lake Drive
Big Bear Lake, CA -
$729,900
1298 Luna Road
Big Bear City, CA -
$735,000
1195 S Minton Avenue
Big Bear City, CA -
$729,900
1298 Luna Road
Big Bear City, CA -
$515,000
1709 Columbine Drive
Big Bear Lake, CA -
$599,900
1245 Alpinview Drive
Big Bear City, CA -
$1,475,000
43451 Sheephorn Road
Big Bear Lake, CA -
$769,900
42729 Haupstrasse Drive
Big Bear, CA -
$769,900
42729 Haupstrasse Drive
Big Bear Lake, CA -
$749,000
39789 Forest Road
Big Bear Lake, CA -
$825,000
435 Ashwood Drive
Big Bear City, CA -
$749,900
42387 Balboa Lane
Big Bear Lake, CA -
$825,000
435 Ashwood Drive
Big Bear Lake, CA -
$1,475,000
43451 Sheephorn Road
Big Bear Lake, CA -
$395,000
42582 Alta Vista Avenue
Big Bear Lake, CA -
$719,900
505 Barrett Way
Big Bear City, CA -
$155,000
475 Thrush Drive #24
Big Bear Lake, CA -
$349,900
110 Pine View Drive
Big Bear City, CA -
$269,000
191 Santa Barbara Avenue
Sugarloaf, CA -
$349,900
110 Pine View Drive
Big Bear City, CA -
$599,900
43065 Goldmine Woods Lane #0
Big Bear Lake, CA


-
$430,000Lot Size2,501 sqft
Home Size1,488 sqft
Beds3 Beds
Baths2 Baths
-
$599,000Lot Size100.00 ac
Home Size1,672 sqft
Beds4 Beds
Baths3 Baths
-
$599,000Lot Size101 sqft
Home Size1,672 sqft
Beds4 Beds
Baths3 Baths
-
$1,025,000Lot Size6,800 sqft
Home Size1,504 sqft
Beds4 Beds
Baths2 Baths
-
$2,245,000Lot Size1.71 ac
Home Size4,072 sqft
Beds4 Beds
Baths4 Baths
-
$637,777Lot Size8,124 sqft
Home Size1,420 sqft
Beds3 Beds
Baths2 Baths
-
$729,900Lot Size12,999 sqft
Home Size2,162 sqft
Beds4 Beds
Baths2 Baths
-
$729,900Lot Size13,000.00 ac
Home Size2,162 sqft
Beds4 Beds
Baths2 Baths
-
$637,777Lot Size8,125.00 ac
Home Size1,420 sqft
Beds3 Beds
Baths2 Baths
-
$2,245,000Lot SizeN/A
Home Size4,072 sqft
Beds4 Beds
Baths4 Baths
-
$375,000Lot Size2,501 sqft
Home Size798 sqft
Beds2 Beds
Baths1 Bath
-
$789,000Lot Size7,488 sqft
Home Size1,852 sqft
Beds3 Beds
Baths2 Baths
-
$1,050,000Lot Size12,502 sqft
Home Size3,086 sqft
Beds3 Beds
Baths3 Baths
-
$1,050,000Lot Size12,500.00 ac
Home Size3,086 sqft
Beds3 Beds
Baths3 Baths
-
 $215,000Lot Size2,401 sqft
Home Size532 sqft
Beds1 Bed
Baths1 Bath
-
$449,900Lot Size968 sqft
Home Size1,359 sqft
Beds3 Beds
Baths2 Baths
-
$375,000Lot Size2,500.00 ac
Home Size798 sqft
Beds2 Beds
Baths1 Bath
-
$599,900Lot Size1,286 sqft
Home Size1,450 sqft
Beds2 Beds
Baths3 Baths
-
$719,900Lot Size4,931 sqft
Home Size1,720 sqft
Beds3 Beds
Baths3 Baths
-
$625,000Lot Size8,316 sqft
Home Size1,274 sqft
Beds3 Beds
Baths2 Baths
-
$625,000Lot Size8,314.00 ac
Home Size1,274 sqft
Beds3 Beds
Baths2 Baths
-
$699,900Lot Size8,002 sqft
Home Size2,000 sqft
Beds3 Beds
Baths2 Baths
-
$449,900Lot Size966.00 ac
Home Size1,359 sqft
Beds3 Beds
Baths2 Baths
-
$699,900Lot Size8,000.00 ac
Home Size2,000 sqft
Beds3 Beds
Baths2 Baths
-
$1,149,000Lot Size7,341.00 ac
Home Size2,436 sqft
Beds4 Beds
Baths4 Baths
-
$1,149,000Lot Size7,340 sqft
Home Size2,436 sqft
Beds4 Beds
Baths4 Baths
-
$779,900Lot Size9,800.00 ac
Home Size1,602 sqft
Beds3 Beds
Baths2 Baths
-
$799,000Lot Size7,776 sqft
Home Size1,920 sqft
Beds4 Beds
Baths2 Baths
-
$365,000Lot Size13,500.00 ac
Home Size480 sqft
Beds1 Bed
Baths1 Bath
-
$799,000Lot Size6,892.00 ac
Home Size2,142 sqft
Beds4 Beds
Baths2 Baths
-
$729,900Lot Size7,802 sqft
Home Size2,442 sqft
Beds4 Beds
Baths3 Baths
-
$735,000Lot Size7,802 sqft
Home Size1,692 sqft
Beds4 Beds
Baths2 Baths
-
$729,900Lot Size7,800.00 ac
Home Size2,442 sqft
Beds4 Beds
Baths3 Baths
-
$515,000Lot Size9,431 sqft
Home Size966 sqft
Beds2 Beds
Baths1 Bath
-
$599,900Lot Size7,500.00 ac
Home Size1,724 sqft
Beds3 Beds
Baths2 Baths
-
$1,475,000Lot Size7,994 sqft
Home Size3,468 sqft
Beds6 Beds
Baths5 Baths
-
$769,900Lot Size7,632 sqft
Home Size1,950 sqft
Beds3 Beds
Baths3 Baths
-
$769,900Lot Size7,630.00 ac
Home Size1,950 sqft
Beds3 Beds
Baths3 Baths
-
$749,000Lot Size8,421 sqft
Home Size1,616 sqft
Beds3 Beds
Baths2 Baths
-
$825,000Lot Size8,081 sqft
Home Size1,780 sqft
Beds4 Beds
Baths3 Baths
-
$749,900Lot Size13,421 sqft
Home Size1,476 sqft
Beds3 Beds
Baths2 Baths
-
$825,000Lot Size8,079.00 ac
Home Size1,780 sqft
Beds4 Beds
Baths3 Baths
-
$1,475,000Lot Size7,992.00 ac
Home Size3,468 sqft
Beds6 Beds
Baths5 Baths
-
$395,000Lot Size5,363 sqft
Home Size576 sqft
Beds2 Beds
Baths1 Bath
-
$719,900Lot Size4,929.00 ac
Home Size1,720 sqft
Beds3 Beds
Baths3 Baths
-
$155,000Lot Size872 sqft
Home Size1,512 sqft
Beds2 Beds
Baths2 Baths
-
$349,900Lot Size3,568 sqft
Home Size811 sqft
Beds2 Beds
Baths1 Bath
-
$269,000Lot Size4,749 sqft
Home Size570 sqft
Beds1 Bed
Baths1 Bath
-
$349,900Lot Size3,568.00 ac
Home Size811 sqft
Beds2 Beds
Baths1 Bath
-
$599,900Lot Size1,283.00 ac
Home Size1,450 sqft
Beds2 Beds
Baths3 Baths

