Foreclosure filings in Big Bear dropped in July 2010, down 5% when compared to June, continuing the zig-zag uncertainty of the Big Bear foreclosure market. Year over year, foreclosure filings were down 14% from the July 2009 numbers, the seventh straight month that foreclosure filings were down year over year.
Notices of sale saw a decent size drop while notices of default were down slightly. The number of properties going back to the bank in July came back up, but it was still on the lower end of the monthly average.
Keep in mind, foreclosure filings are made up of three parts – Notices of Default (NOD), a recorded document that starts the foreclosure process, which is normally filed after homeowners fall behind in their payments. The timing of when the lender files this can vary from the 1 month to over 12 months, depending upon how aggressive they want to be and the new rules they must follow. Notices of Sale (NOS), a recorded document that is typically filed between 3-6 months after the NOD, which sets the date for the Trustee Sale. Trustee Sales, typically held around 25 days after the NOS is filed, is made up of properties that go back to the bank, generally on the court house steps.
Trustee sales have only three possible outcomes – the property goes back to the bank (which is most common); the property is bought by a 3rd party, those (typically investors) who buy the properties at the trustee sales instead of it going back to the bank; and properties that are canceled, or pulled from sale. I generally have not included these last two as they have always been pretty minor in numbers. The past few months however, I am starting to see an increase in both cancellations and third party sales, so I will start posting this numbers as well.
Here’s how the foreclosure numbers broke down for July 2010.
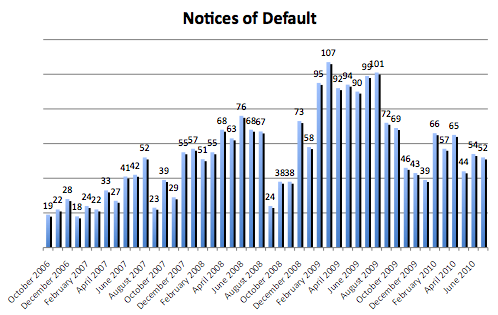
Notices of Default (NOD) – 52 total, down 4% from June and down 47% from July 2009.
Big drop from the all time highs we saw last year, but still elevated and up month over month.
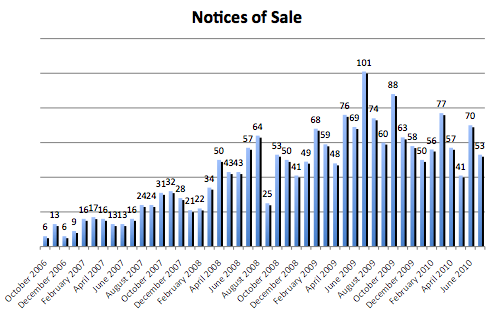
Notices of Sale (NOS) – 53 total, down 24% from June and down 48% from July 2009.
July 2009 was the highest we’ve seen for these numbers so the 48% drop YOY is not all that dramatic. The 53 NOS we saw in July is on the lower end of the monthly average the past year however.
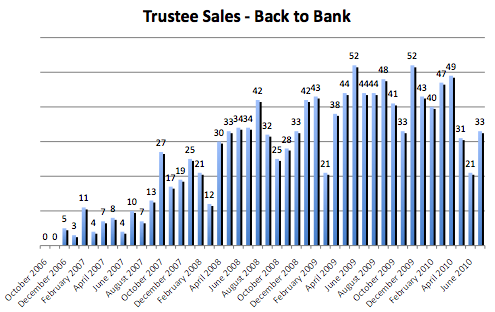
Trustee Sales – Back to the bank – 33 total, up 57% from June but down 25% from July 2009.
This number jumped up from the low point in June, but it still remains on the lower side of the monthly average of 40-50 we’ve been seeing most of the year.
Trustee Sale – Cancellations
Cancellations have been elevated the past few months, and the 26 in July followed along the same line. The more cancellations, the lower the number of distressed properties that will be hanging on the market.
What are reasons for these cancellations? I know of several – 1. the homeowner cures the defaulted amount; 2. the homeowner modifies their loan; 3. the homeowner completes a short sale; or 4. the lender incorrectly filed the foreclosure paperwork and has to start over.
Trustee Sales – Sold to 3rd Parties
There were 6 properties sold to third party investors in the month of July, 1 less that the all time high. Expect this number to see this number fall in the 1-10 range over the next year or so. Most of time, these properties will be put back on the market with the investors looking to make a 10-50% return!
Buying a property at the trustee sale has a lot of risks – has to be a cash purchase, “as is” with no inspections, no title insurance, eviction possibility, etc. The major reward is the potential to buy a property at well below market value. To those that have the time, skills and patience, trustee sales can be very lucrative.
Want to see what actually happens at Trustee Sales? Check out the video below.
Direct link to the YouTube video
Foreclosure Inventories In Big Bear (aka the Foreclosure Pipeline)
| Feb. 2010 | Mar. 2010 | April 2010 | May 2010 | June 2010 | July 2010 | |
| Preforeclosure (Notice of Default) | 166 | 187 | 189 | 169 | 169 | 190 |
|---|---|---|---|---|---|---|
| Auction (Notice of Sale) | 192 | 186 | 168 | 167 | 169 | 156 |
| Bank Owned | 175 | 179 | 167 | 148 | 133 | 121 |
The total amount of properties in default jumped up in July, while those with a notice of sale or those that are bank owned dropped – 190 properties have an NOD filed against it, 156 a Notice of Sale, and 121 are currently owned by the Bank. Of those 121 that are bank owned, some are already on the market for sale, some are not, and a small amount have already re-sold to new owners. All in all, month over month, the foreclosure inventory in Big Bear is down .05% from last month.
Why are foreclosure numbers important? In my opinion, they are the most important stat to keep track of as they offer a glimpse into the future of any market. Everyone knows that foreclosures bring prices down in neighborhoods. So, the more foreclosures in an area, the more the downward push on pricing. And, if we want the market/prices to get better, we need to get all of these properties through the foreclosure pipeline first.
Til next month…..





Speak Your Mind